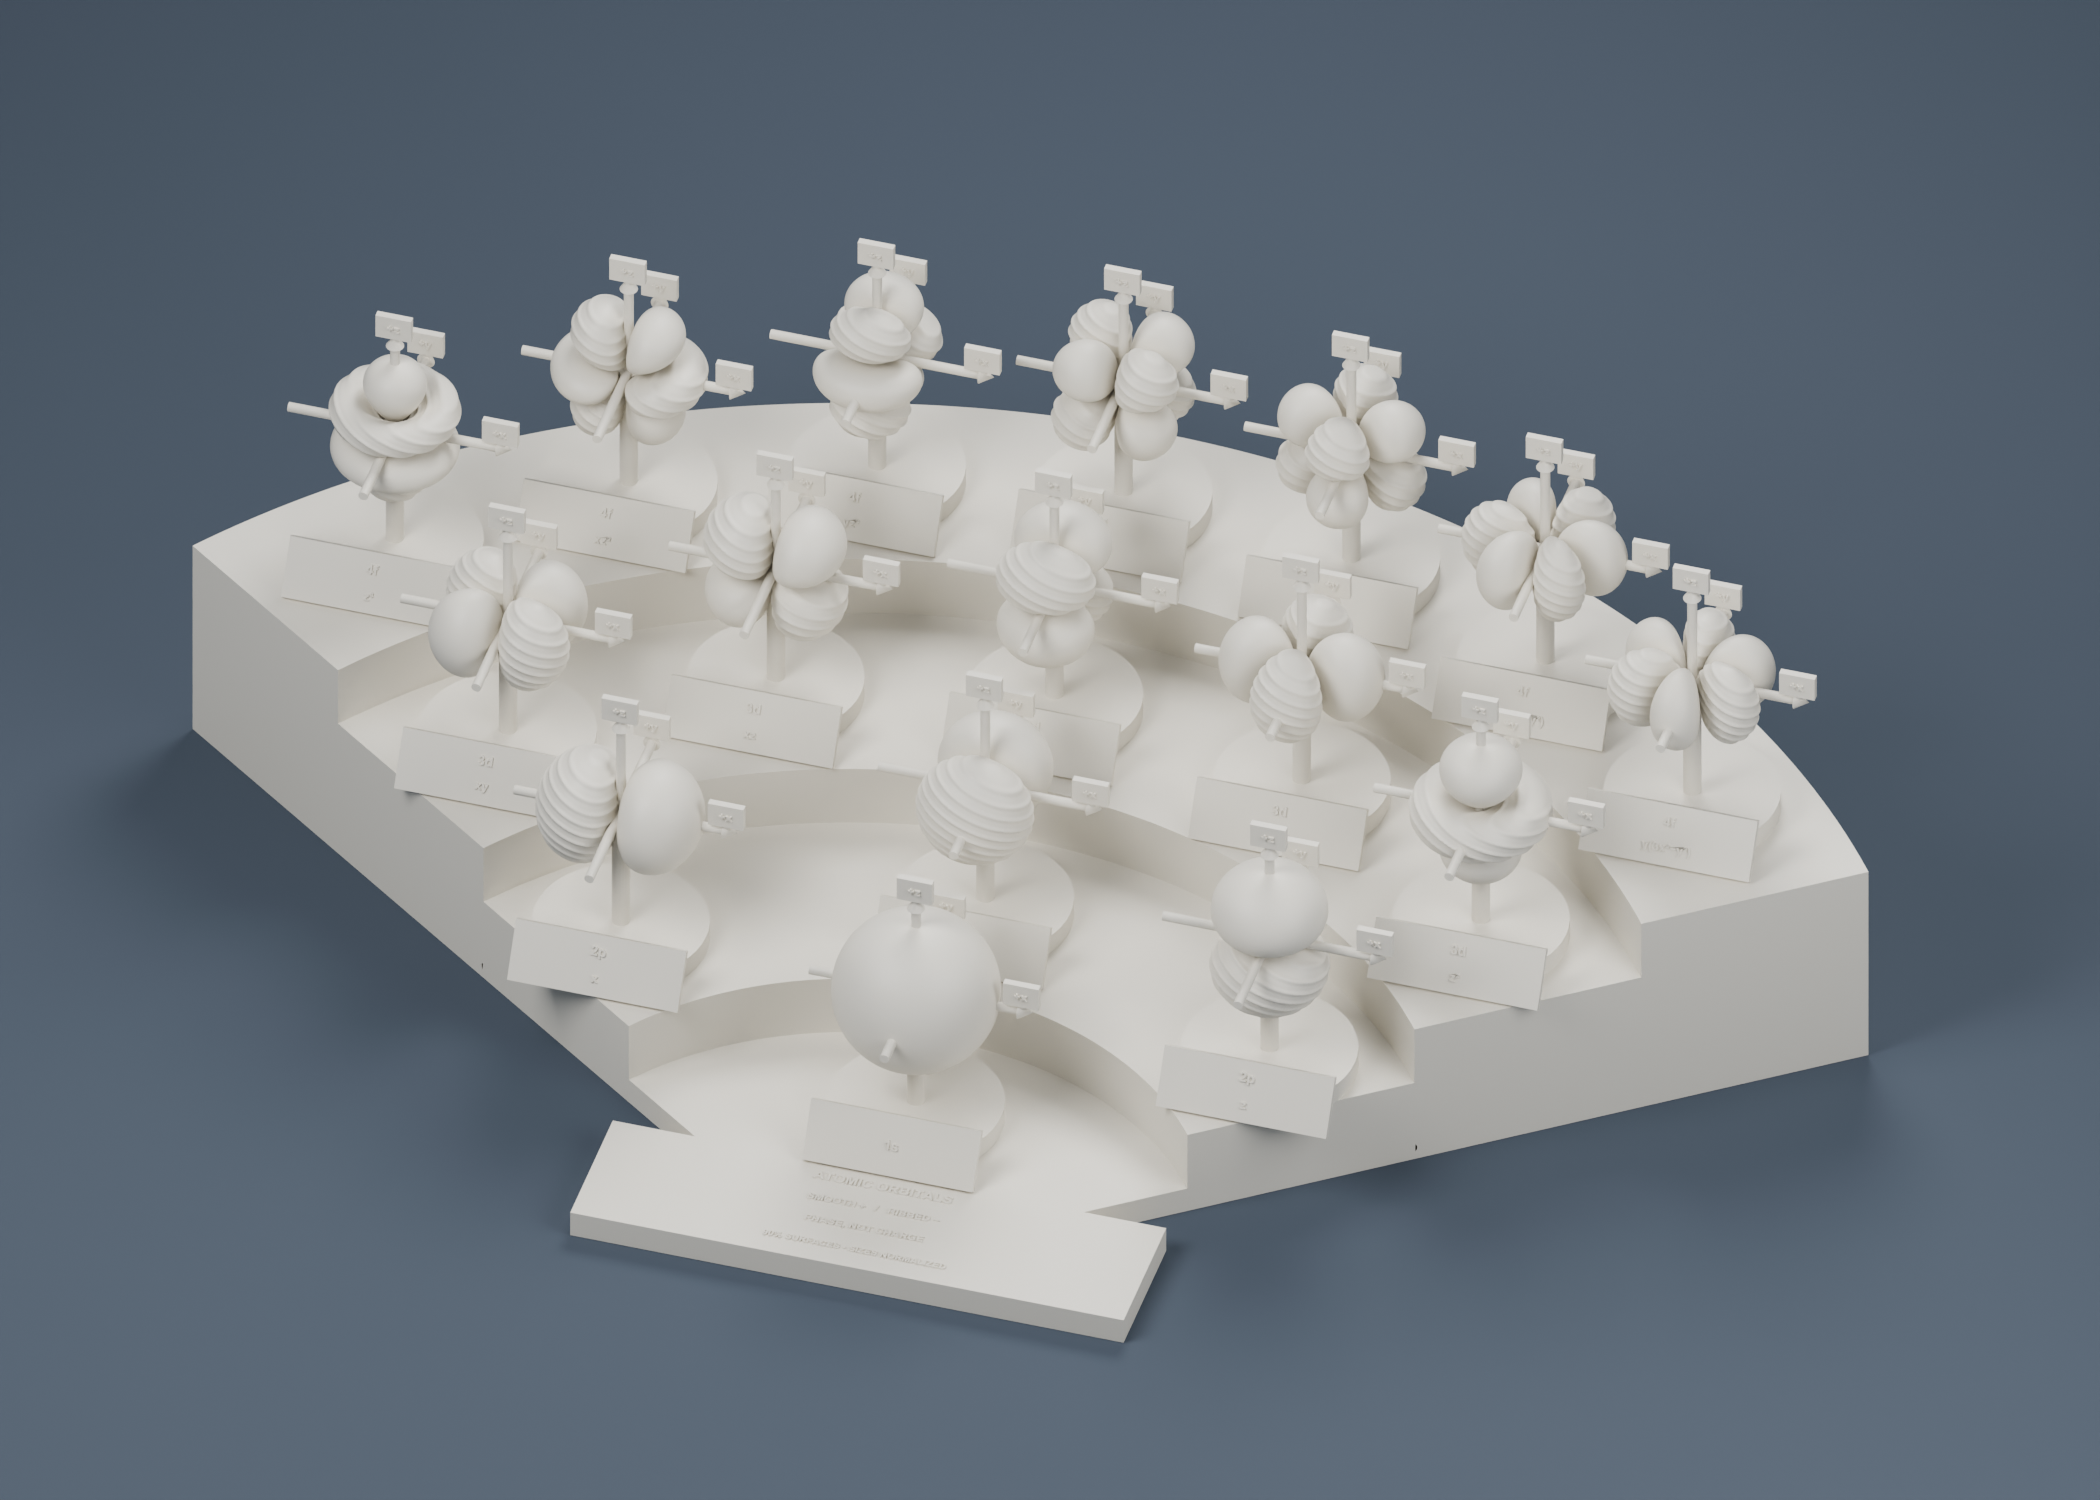
Orbital diagrams are everywhere in chemistry, but a flat drawing can make a three-dimensional idea surprisingly difficult to see. I wanted to build something students could walk around, turn in their hands, and compare with the diagrams in their notes. That idea became the Orbital Observatory: a curved, tiered display of sixteen labeled electron orbitals.
I developed the design with help from AI, using mathematically generated orbital surfaces and then adapting them for 3D printing. The project brings together several things I enjoy: chemistry, coding, making things, and finding new ways to explain difficult concepts.
Explore the orbitals in 3D
To compare physical extent with one shared ruler, visit Orbital Observatory: A Sense of Scale. Its sixteen hydrogenic orbitals retain their relative sizes, and a nuclear-charge control explores one-electron H, He⁺, Li²⁺, and Be³⁺.
For the mathematics behind the shapes, explore From Wavefunction to Orbital: four linked views of radial functions, angular functions, cross-sections, and probability surfaces, including all sixteen Observatory orbitals and three radial-node examples.
For orbital mixing and interference, explore Orbital Observatory: How Orbitals Mix, with an s/p-character slider and complete sp, sp², and sp³ sets.
Drag to rotate the display, then use Inspect to look at one orbital at a time. You can scroll or use the zoom buttons to move closer. With the viewer focused, the arrow keys rotate and the + and − keys zoom.
Open the interactive viewer in a full page ↗
This interactive model is the earlier angular-shape exploration, with equally scaled shapes and two colors for wavefunction phase. It is different from the final printable geometry shown in the render above. The viewer needs JavaScript and WebGL; the render remains available if your browser cannot display the model.
Designed for a single-color printer
The print set includes 1s, three 2p, five 3d, and seven 4f orbitals. This gives one complete set of angular shapes for each of the s, p, d, and f subshell types; it is not every orbital through the fourth principal energy level.
Each orbital has its own stand, name, and consistently oriented x, y, and z axes. The modular base and keyed mounts are designed for my Elegoo Neptune 4. The assembled display is approximately 47 × 29 × 15 cm, with the individual parts printed separately.
Because I print in one color, the physical model uses texture instead of color: smooth surfaces indicate positive wavefunction phase, and ribbed surfaces indicate negative phase. Those signs are not electrical charges. The labels and texture are built into the geometry rather than added as paint.
The underlying printable surfaces come from hydrogenic wavefunctions and collectively enclose approximately 90% of each orbital’s probability. The ribs, stems, axes, and other supporting pieces are additions that make the display usable as a physical object. They are not part of the electron distribution.
A teaching aid for the CCLC
I plan to use this display in the Chemistry Community Learning Center (CCLC), where students can get help working through chemistry problems and difficult concepts. My hope is that having something physical to explore will make those conversations easier to begin.
Here are a few ways I would like to use it during tutoring:
- Connect a drawing to a shape. Start with a familiar p-orbital diagram, then rotate the corresponding module and identify what the page leaves out.
- Compare orientation. Use the labeled axes to distinguish pₓ, pᵧ, and p_z, then compare d orbitals whose lobes point along or between axes.
- Talk about nodes and phase. Look at the regions separated by angular nodes and use the smooth/ribbed distinction to discuss the sign of the wavefunction.
- Build confidence with unfamiliar shapes. Compare the simpler s and p orbitals with the more intricate d and f forms without expecting students to memorize every shape at once.
Just as useful are the questions about what the model leaves out. An orbital is not an electron’s path, and its displayed surface is not a hard boundary. These orbitals are scaled independently for comparison, so their sizes and positions on the tiers do not show relative atomic size or orbital energy. Supports crossing a gap do not mean electron density exists at a node.
The selected orbitals also have no radial nodes. Higher-energy orbitals of the same subshell type can have additional structure that this set does not show. I want those limitations to be part of the lesson: a good model helps us understand something, and understanding the model means knowing where the analogy stops.
From design to the tutoring table
Download the STL files and printing guides on GitHub The printable set contains 25 STL designs, including the sixteen orbital modules, six base sections, a joining dowel, and two mount-fit test pieces. The accompanying teaching and assembly guides explain the geometry, phase convention, and printing setup.
The design has passed digital mesh checks, but a completed slice and physical print still need to be verified. I’ll start with the small fit test before printing the full display. I’m looking forward to bringing it into the CCLC and seeing which shapes—and which questions—students reach for first.
The mathematics behind the model is documented in the project’s teaching guide, using Oregon State University’s hydrogen-atom wavefunction tables and the real spherical harmonics reference.